¶ 1. General Information
CAN Spy is a universal tool for working with the CAN bus, designed for monitoring and analyzing data exchange within an automotive CAN network. The program also allows users to independently configure devices manufactured by Navtelecom for transmitting parameters obtained from the CAN bus to a telematics server.
¶ 2. Installation and Launch
¶ 2.1. Installation
CAN Spy is included in the NTC Configurator software package. The latest version of the configurator can be downloaded via the link.
¶ 2.2. First Launch
CAN Spy is launched from the “Advanced” menu.

When launched for the first time, the main program window will open.
¶ 3. Interface Overview

The CAN Spy interface is organized into functional areas, providing convenient navigation and efficient data analysis.
¶ 3.1. Menu Bar
At the top of the window, there is a menu bar containing the following items:
- File
Access to panel and workspace settings. - View
Control of panel and workspace visibility. - Tools
Access to the auxiliary function “Message Filtering”. - Help
Link to the online documentation.
¶ 3.2. Channel Configuration Area
The CAN interface configuration area includes:
- Selection of the data source (real interface or Log player).
- Setting the CAN bus speed (for example, 500000 bit/s).
- Operating mode (active/passive).
- Data flow control (start/stop).
- Loading and playback of log files with time control.
- Connection status and playback state indication.
More details → Channel configuration
¶ 3.3. Main Workspace
The program workspace includes tabs and panels, each intended for a specific stage of analysis:
-
Messages
Main table with raw CAN messages: ID, DLC, data bytes, MS. -
Message Search
Panel for highlighting messages containing specific data values. -
Byte-by-byte Analysis
Displays each message byte with visual bit-level breakdown. -
Decode by File
Displays decoded CAN parameters using predefined decode files or custom*.decodefiles. -
Record Log
Controls recording of the current CAN message stream. -
Editor
Creation and editing of custom decode files (*.cafand*.decode). -
Scripts
Working with scripts for CAN bus interaction.
The Messages, Message Search, Byte-by-byte Analysis, and Editable Parameter Chart windows can be moved to any part of the interface: top, bottom, right side, outside the main window, or to a separate monitor. To reopen them, use the menu View → Messages.
¶ 4. Channel Configuration
¶ 4.1. Source Selection

To start working with CAN data in the CAN Spy window, you must select a data source. It can be:
- the terminal CAN interface;
- a previously recorded log player.
By clicking the “Open log file” button, you can open the folder containing previously saved logs. By default, the following directory is opened:
C:\Users\Public\NAVTELECOM\NTC Configurator v3\Data\can-logger
After selecting a file, press the Start button to begin log playback. The data will be displayed in the same way as when directly connected to the CAN bus via USB.
If the log folder was archived, the files must be extracted before playback.
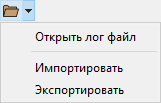
By expanding the tooltip, you can import logs in .csv and .trc formats. The selected log file can also be exported to .csv and .trc.
When selecting the CAN interface as the data source (CAN1 or CAN2), ensure that the device is physically connected to the CAN bus correctly. The connection points to CAN bus wires depend on the specific vehicle or equipment.
 |
Button for opening the “Message Filtering” window |
While configuring the source, the Message Filtering window can be opened using the corresponding button.
¶ 4.2. Bus Speed

The next step in channel configuration is setting the CAN interface speed.
 |
Button “Detect bus speed” |
If the CAN bus data rate is unknown, you can use the automatic detection function. To do this, click the Detect bus speed button.
In the Bus speed (bit/s) field, you can:
- select one of the standard values from the drop-down list;
- or manually enter the required value if it is known in advance.
If the bus speed is detected automatically, incoming CAN messages with data packets will begin appearing in the Messages window.

¶ 4.3. Operating Mode
Passive mode is used for safe connection to a vehicle CAN bus. In this mode, the device only listens to the bus without acknowledging received messages or transmitting data — sending commands or requests is not possible.
If only a single message is displayed in the Messages window, this may indicate that there is no second active module or receiving device on the CAN bus, which is required for proper data exchange.

In such cases, it is recommended either to switch to Active mode or to try connecting to another point of the CAN network where communication between two or more modules is present.
Switching to Active mode in CAN Spy is possible only if the program has already received at least one message in Passive mode at the selected bus speed.

To switch to Active mode, follow these steps:
- Stop message reception by clicking Stop.
- Set the switch to Active.
- Click Start to resume message reception.
If the configured CAN interface speed does not match the actual vehicle bus speed, operating the device in Active mode may disrupt electronic systems, trigger ECU errors, or cause module shutdown.
¶ 4.4. Status
The CAN bus profile status indicator allows quick assessment of connection parameters and operational activity.

When hovering over the indicator, a tooltip window displays extended information for each bus profile (for example, CAN1, CAN2).
Information displayed in the indicator:
- Mode — active or passive.
- Auto speed detection — enabled or disabled.
- Speed — current data rate (in bit/s).
- Transmit to sleeping bus — whether sending data to a bus with no traffic is allowed.
- Status — whether data from the bus is being decoded using the loaded decode file; if not, No data is displayed.
 |
Device is not connected to CAN Spy |
 |
CAN interface is disabled in settings |
 |
Speed detection and message search |
 |
Speed detected, but no data from the decode file |
 |
Data is being decoded according to the decode file |
¶ 5. Working with Messages
¶ 5.1. Messages Table
¶ 5.1.1. General Description
The Messages tab displays CAN bus messages and their values in a table format. This feature allows visual analysis of parameter changes using cell highlighting.

Table column description:
ID – message identifier in HEX.
DLC – data length of the message (in bytes).
D0 – D7 – message data in HEX. Byte numbering starts from “0”, so the first byte is D0, the second is D1, etc.
MS – approximate transmission period of the CAN message on the bus (in milliseconds).
Panel function buttons:
| Icon | Function |
|---|---|
 |
Byte-by-byte Analysis — sends the message to the Byte-by-byte Analysis window. |
 |
Send to Editor — creates a parameter with the selected ID in the Editor window. |
 |
Clear Table — removes all messages from the table. |
 |
Reset Highlight Flags — restores default data display. |
 |
Settings — opens the message display settings window. |
¶ 5.1.2. Clearing the Messages Table
By default, all received messages remain displayed in the table, even if they are no longer transmitted on the bus. To remove outdated messages:
- Click Clear Table, or
- Enable automatic cleanup in Settings: check Automatically clear messages and set the timeout (in milliseconds) after which messages that disappear from the bus will be removed.
Automatic cleanup allows you to see only актуальные data.
It is recommended to disable this feature when switching ignition on/off or when analyzing log files.
¶ 5.1.3. Highlighting Changes in Messages
Whenever a byte value changes, the corresponding cell is highlighted in green. This simplifies the search for target parameters such as:
- pedal status,
- door open/close state,
- seatbelt usage, etc.
Additionally, you can enable the Show changes less frequently option to highlight only those bytes that change less often than the specified threshold (for example, 5000 ms). This helps filter out noisy data.
Highlight control can be applied at the level of individual bytes or entire messages. The corresponding flags can be set or cleared both for specific bytes and for message identifiers.
¶ Remember and do not highlight a value for a specified time
For additional noise filtering, the program provides a history-based highlighting mode. It excludes values that have already appeared before and highlights only truly new data.
This mode allows you to quickly identify bus reactions to user actions (for example, pressing the brake or increasing engine RPM), while ignoring background values that constantly change.
¶ 5.1.4. Recommendations for Searching Parameters on the Bus
- After messages appear, enable Show changes less frequently and set a value, for example, 1000 ms.
- Disable highlighting for all frequently changing bytes.
- Activate the target sensor (for example, press the brake pedal). Observe newly highlighted bytes.
- Repeat the action several times to confirm the dependency.
If no values are highlighted:
- perform Reset Highlight Flags,
- disable highlighting for unnecessary values again,
- repeat the test.
The identified message can be sent to:
- Byte-by-byte Analysis — for detailed structure analysis,
- Editor — to create a custom parameter.
This can be done using the buttons in the table or via the row context menu.
¶ 5.2. Message Filtering
The filtering function allows you to display in the Messages window not the entire stream of CAN identifiers circulating on the bus, but only the portion that is relevant for detailed analysis.
The filter settings window can be opened by clicking the corresponding icon in the Bus/Data Source section or via the Tools menu.

If a filter is active, this will be indicated in the Bus/Data Source settings field.

In the Message Filtering window, you can specify the mask, the range of allowed values, and the RTR bit value.
IDE allows you to quickly set a mask for 11-bit messages, 29-bit messages, or PGN.
RTR = Any – the RTR bit state is ignored during filtering
RTR = No – only messages with RTR bit = 0 will appear in the table
RTR = Yes – only messages with RTR bit = 1 will appear in the table
ID range – only messages with IDs within the specified range will appear in the table.
The “Reset” button disables filtering.
All changes in the Message Filtering window are applied after clicking OK.
After applying a filter, click Clear Table to refresh the message table.
If Automatic message cleanup is enabled, filtered-out messages will be removed automatically.
Example of filter configuration to display 11-bit messages with IDs in the range from 300 to 400:

Example of filter configuration to display J1939 messages with PGN greater than FE00:

Example of filter configuration to display J1939 messages with source address 25:

¶ 5.3. Byte-by-Byte Analysis
The “Byte-by-byte Analysis” window is designed for detailed monitoring of changes in individual bytes of CAN bus messages. It allows you to:
- Set data reception conditions.
- Apply masks to analyze specific bytes.
- Display values on real-time charts.
The tool is useful for:
- Determining the type of transmitted data (bit field, numeric value).
- Detecting on/off states of sensors and mechanisms.
- Analyzing byte order and data length.

Panel function buttons:
 |
Update ID — transfers the ID of the selected entry from the Messages table to the corresponding field. |
|
Send to Editor — creates a parameter with the selected ID in the Editor window. |
 |
Pause — stops data updates in the panel. |
|
Clear Table — removes all messages from the table and charts. |
|
Settings — opens the message display settings window. |
¶ Window Structure
¶ “Reception Condition” Block
Allows you to configure the condition under which a message will be displayed on the chart and in the history table. It is used to filter parameters that depend on the value of specific bytes.
In the FMS (Fieldbus Message Specification) standard, the first byte (D0) indicates the axle number, while bytes D1 and D2 contain the load value for that axle. To obtain the value for axle No. 2:
- Set the mask value for byte D0 tof0
- In the “Value” field, set10

For each byte in the mask and value row, you can quickly set:
- value
00using the button to the left of the byte field, - value
ffusing the button to the right of the byte field.
Additional buttons allow setting 00 or ff simultaneously for all eight bytes — they are located on the right side of the panel.
¶ “Mask Filtering” Block
Allows you to hide unnecessary data and highlight only the relevant bytes. The mask specifies which bits should be considered during analysis.
This block helps to:
- isolate parameters for subsequent decoding in the Editor,
- configure the display of only a single value from the message.

As in the “Reception Condition” block, mask values can be quickly set:
00— using the button to the left of the byte field,ff— using the button to the right of the byte field,- for all 8 bytes at once — using the corresponding buttons on the right side of the panel.
¶ Message History Table
Displays a list of received messages that match the specified conditions and mask. Includes:
- data length (DLC),
- bytes D0–D7,
- time counted from the start of data reception in the Byte-by-byte Analysis panel (MS).

¶ “Charts” Block
Contains 8 separate charts showing changes in each byte value over time.
- Each chart corresponds to one byte (D0–D7).
- Bit indicators are displayed above the chart: if a bit equals
1, it is highlighted in green. - Convenient for analyzing frequent changes or cyclic data.

¶ Chart Display Modes
¶  Real-Time Scale
The chart is displayed and updated in real time, even if no new messages are received. Suitable for high-frequency messages (less than 500 ms).
- You can set the analysis period — the time range of displayed data.
¶  Sliding Scale
The chart updates only when a new message is received. If no new data arrives, the chart remains unchanged. Optimal for low-frequency messages (more than 1000 ms).
- You can set the number of points displayed on the chart (buffer size).
¶ Additional Display Settings
The Additional Settings block allows you to control the visibility and behavior of interface elements related to data display and filtering.
Available parameters:
- Show reception condition — enables or disables the display of the byte filter used to control message visibility on the chart and in the history table.
- Show filters — displays or hides the mask block applied to message bytes.
- Display data table — controls the visibility of the parameter value table below the chart.
- Chart display modes — allows configuration of chart format: select the operating mode, set the time scale duration, and define the number of displayed points.

¶ 5.4. Message Search
This panel is designed for searching and filtering numeric values in CAN bus messages based on specified parameters and conditions. It supports value scaling, bitwise masking, and configuration of data format and byte order.
¶ Panel Function Buttons:
|
Byte-by-byte Analysis — sends the message to the Byte-by-byte Analysis window |
|
Send to Editor — creates a parameter with the selected ID in the Editor window |
|
Clear Table — removes all messages from the table and charts |
 |
Filters — expands additional search settings |
- Data type — defines the data interpretation format:
uint8,int8,uint16,int16, etc. - Output format — number system selection:
DEC— decimal,
HEX— hexadecimal. - Search value — the original numeric value to which scaling is applied using the formula
Y = X × A + B. The result of this transformation is used to search for matches in the CAN message stream. - Tolerance — defines the acceptable range within which a value is considered a match (for example, ±5 from the target value).
¶ Additional Settings
(expanded when the Filters option is enabled)
- Byte order — defines the interpretation direction:
Little-endianorBig-endian. - Mask — bitwise mask applied before scaling. Setting
ffffffffmeans all bits are taken into account. - Scaling (Y = X × A + B) — formula used to calculate the value compared with the CAN message content.
X— user-defined search value,A— scaling factor,B— offset,Y— result that must be found in the message stream.
The “Reset” button restores all additional parameters to their default values.
¶ Search Results
At the bottom of the panel, a table displays messages that match the specified filtering conditions. Each row contains:
- ID – CAN message identifier (in the selected number system).
- DLC — data length of the message (in bytes).
- D0–D7 — message byte values.
- MS — approximate message appearance period (in milliseconds).
- Value — result calculated using the formula
Y = X × A + Bfor the detected data segment matching the entered value.
The bytes where a match is found are highlighted in green, allowing quick identification of the value location within the message.
¶ Identifier Blacklist
To exclude unnecessary or interfering messages from analysis, you can use the identifier blacklist (ID).
¶ How to add a message to the blacklist:
- In the results table, right-click the desired message.
- Select “Add to blacklist” from the context menu.
After adding:
- The blacklist icon (on the toolbar) changes its appearance:
 |
If the list is empty, the icon appears inactive. |
 |
If IDs are present, the icon becomes active. |
- Messages with the specified IDs will no longer appear in the search results.
¶ Managing the Blacklist:
Access management via the dropdown button:

The menu provides two actions:
- Blacklist — opens the exclusion editing window where you can:
- manually add/remove IDs,
- clear the list,
- import/export the list to a file.

- Enable/Disable Blacklist — turns the filter on or off.
When disabled, messages are displayed again regardless of whether they are in the list.
When the blacklist filter is active, messages included in it will not appear in the table even if they fully match the search conditions.
¶ 6. File Editor
The “File Editor” window allows you to create custom files that define CAN message decoding rules. Files are saved in the *.caf format. This format takes into account the specifics of CAN bus processing algorithms used in Navtelecom devices.
Custom *.caf files created in the Editor can be compiled into a special *.decode format for subsequent upload to Navtelecom devices.
Files in the
*.decodeformat are closed: they cannot be exported from the device and cannot be opened or modified in the Editor window.
To verify the operation of*.decodefiles, use the Decode by File tab.
The Editor window also allows importing CAN files from other formats:
.dbc(CAN DBC).bim(ACE_Lab)
¶ 6.1. Editor Function Buttons
The main file management controls are located on the top panel of the editor:
 |
Create new file opens a window where you need to specify the vehicle description and CAN bus |
 |
Open file — load a previously saved .caf. |
The dropdown menu also contains an “Import” button, which is used to import CAN decoding files in *.dbc (CAN DBC) and *.bim (ACE_Lab) formats.

 |
Save - saves the current *.caf file. |
In the dropdown menu, the “Save as” button allows saving the file under a new name.

 |
Compile *.decode file. See details in custom file compilation |
In the dropdown menu there is also a button “Upload decode file to device” for uploading a previously compiled *.decode file to the device.

 |
Vehicle description |
 |
Add bus |
 |
Add parameter to the selected bus |
The parameter dropdown menu contains parameter addition options.
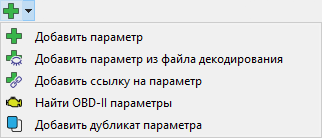
- Add parameter from decode file - add a parameter from the library of ready-made decoding files.
- Add parameter link - a parameter link allows configuring parameter decoding on multiple buses without creating new parameters.
- Find OBD-II parameters - searches for available parameters via OBD requests. The found parameters can be added to the decode file.
- Add parameter duplicate - duplicate the selected parameter within the same bus.
 |
Delete selected parameter or bus |
¶ 6.2. Creating a Custom File
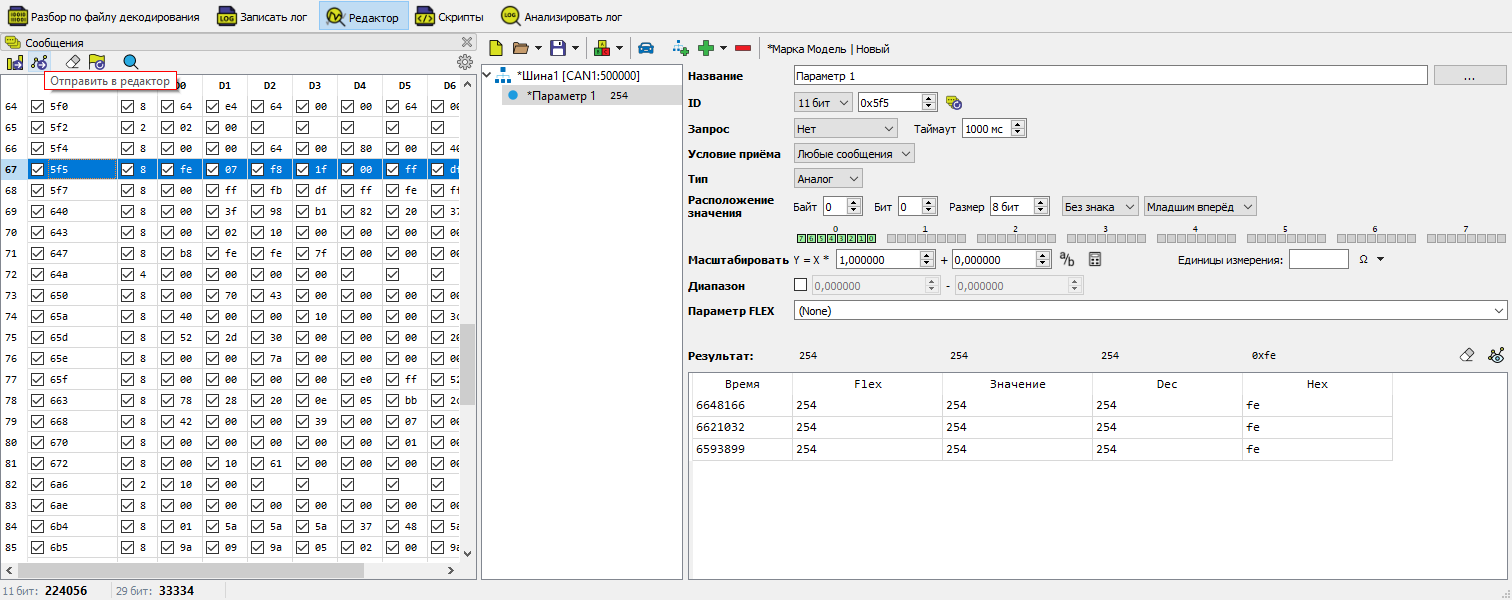
When CAN Spy is launched for the first time, the “File Editor” window offers a new file template with one pre-created parameter (“Parameter1”) inside.

Data marked with the
*symbol is not saved. When closing the CAN Spy window without saving, all file data and Parameter values marked with this symbol will be lost. To save changes, click Save
To create a new file, click Create new file. In the window that appears, fill in the vehicle description whose CAN bus you are connected to. You must specify the vehicle make and model. It is also recommended to enter production years and connection comments. This information will be saved in the file with the detected parameters and will be useful for future work.
The vehicle description can be edited at any time by clicking the corresponding button.

For each vehicle, you can add one or several CAN buses by clicking the button
¶ Bus Configuration
Profile represents the CAN interface configuration applied after uploading the decode file to the device. This setting is relevant for devices with two CAN interfaces and allows specifying which physical CAN interface the settings of this bus will apply to in the device. If the decode file is intended for devices with a single CAN interface, the profile “CAN1” must be selected.
Bus speed - the data transfer rate on the selected bus. It is set automatically according to the speed detected when connecting to the device or playing back a log. This setting can be edited later.
If the CAN interface speed is selected incorrectly in the file, the device will not be able to receive data from the bus. Operating in active CAN mode may disrupt the vehicle CAN bus, cause controller errors, and may also lead to onboard electronics failure.
Device address - a setting required when sending requests to the bus in J1939 format. If necessary, specify the source address, that is, the device’s own address from which it will send requests to the vehicle bus.
By default, the bus name is Bus1, profile CAN1, communication speed 500 kbit/s, source address 0xff.
The bus name can be changed by the user at their discretion.
¶ Adding Parameters
Parameters in the custom file can be added manually or by using built-in mechanisms for searching and reusing already described parameters.
¶ Manual Addition
- Using the Add parameter button, you can add a completely empty parameter without presets.
- Using the Send to editor button from the messages table, a parameter is added with the pre-set identifier of the selected message.
¶ Adding a Parameter from a Decode File
The Add parameter from decode file button opens a functional window where you can select a decode file and the parameters to be added to the custom decode file.
In the added parameter, the content is hidden, but you can change its name and FLEX parameter.
¶ Parameter Configuration
¶ Main Attributes
| Field | Description |
|---|---|
| Name | Unique parameter name for identification (required field) |
| ID | Message identifier in HEX (11/29 bit or PGN for FMS/J1939) |
¶ Message Type
RTR— Remote Transmission Request (frame without data)ISO-TP (OBD-II)— Standardized diagnostic protocolSAE J1939— Protocol for commercial vehicles
¶ Data Type
| Option | Description | Value range |
|---|---|---|
| Analog | Floating-point number (Float) | Depends on bit length |
| Counter | 32-bit integer | 0...4 294 967 295 |
| Discrete | Logical value | 0 (False) / 1 (True) |
¶ Data Location
- Byte — Starting byte number (0-7)
- Bit — Starting bit position (0-7)
- Size — Data length in bits (1-32)
- Signedness:
Signed— Most significant bit as sign (e.g., -128...127 for 1 byte)Unsigned— Positive values only (0...255 for 1 byte)
- Byte order:
LE(Little Endian) — Least significant byte first (used in J1939)BE(Big Endian) — Most significant byte first
For parameters, the allocated size corresponds to the FLEX standard.
When working with J1939, it is recommended to use LE byte order.
¶ Reception Condition
Defines the conditions under which data will be parsed from the message:
- Any message — no restrictions (recommended)
- If equal / If not equal — condition based on the value of another byte in the message
Configuration:
- Value — specified in decimal format
- Value location — defines the mask: starting bit position and bit length
Example — using the If equal condition for the parameter Axle 2 load

¶ Scaling
This setting allows transforming raw data using a coefficient and offset to obtain values in the required measurement units:
Result = Value * (Coefficient) + Offset
- Coefficient can be specified as a number or a simple fraction. Switch using the Simple fraction button.
- Offset can be either a positive or a negative number.
The coefficient and offset values can be calculated in the Scaling Calculator. The raw value from the bus is entered as input data, and the desired scaled value is entered as output data. If two points are specified, both the coefficient and the offset can be calculated.

The calculated values can be immediately applied to the parameter by clicking OK.
Measurement units - optional, not used in decoding
¶ Range
The range parameters of valid values are used to filter out incorrect data.
For example, for a fuel level parameter it is recommended to set a non-zero lower limit, since when the ignition is turned on, the value 0 may be briefly transmitted on the bus, which leads to distorted reports.
The maximum value may also be used by the device to indicate the absence of актуальные data and should be excluded from processing.
¶ FLEX Parameter
The FLEX Parameter is a parameter of the FLEX protocol in which the parameter values are transmitted from the device to the monitoring system server.
The parameter consists of:
- Parameter tag (
sc1–80,ac1–255,bc1–92,ic) - Name (for example, Fuel level in tank)
- Resolution (
0.1 l,%,0.005 km, etc.) - Type and size in bits (
UInt32,UInt16,Bit, etc.)
Important! If the monitoring system supports the FLEX protocol, parameters with sc tags will be additionally scaled on the server side according to the parameter resolution. This must be considered when selecting the coefficient.
An incorrectly specified resolution may lead to distorted data in the monitoring system.
For example:
sc6: Total vehicle mileage, 0.005 km
will be multiplied by0.005to convert the value to kilometers.
Parameters with ac and bc tags are configured as custom parameters (FLEX 207–252) and are not automatically scaled on the server side.
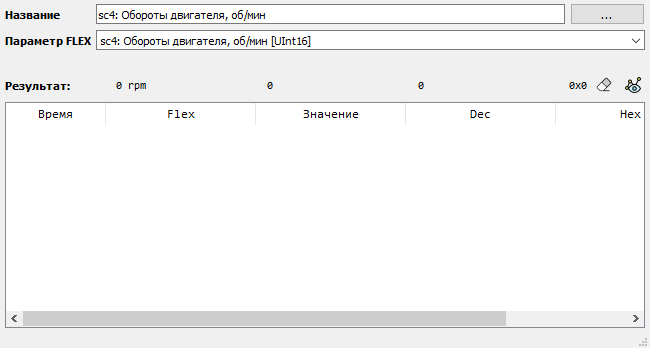
¶ Result
In the Result field, the last decoded parameter value is displayed in three representations:
- Value - result after applying all scaling and offset settings
- Dec - raw value in decimal format, before scaling
- Hex - raw value in hexadecimal format
These values are also saved in the results table with a timestamp counted from the moment data reception started in the channel.
The value is additionally displayed next to the parameter name in the decoding file tree.

The table can be cleared using the "Clear points" button. The Show graph button opens the results graph in a separate window.
The graph supports real-time display mode and floating scale mode, similar to byte-by-byte analysis. The Y-axis range is determined automatically based on the minimum and maximum parameter values or can be set manually.
¶ 6.3. Compilation of the Custom File
To compile the decoding file, click the Compile decoding file and upload to device button. The decoding file creation wizard will open.
¶ Information Page
Contains information about the vehicle and the file version.

¶ CAN Profile Pages
Allow selecting the buses that will be used for data decoding within the corresponding profile.

¶ Messages Page
Contains a table of parameters, file characteristics, and limitations.

The table includes the following columns:
- Name - parameter name defined by the user, indicating its location in the decoding file tree.
- Flex - FLEX parameter and configuration status indicator:
- green - parameter configured correctly;
- yellow - multiple parameters use the same FLEX tag;
- red - FLEX tag not selected.
- Request - request type used to obtain the parameter, if applicable.
- Period / Timeout - time in milliseconds during which the parameter is considered valid after being received.
¶ File Characteristics
Displayed on the right side of the window and include:
- File size
- Number of messages - number of unique IDs
- Number of parameters
- Number of requests
After completing the setup, the file can be:
- written to the device - "Write to device" button,
- saved to the computer - "Save" button,
- compilation canceled - "Cancel" button.
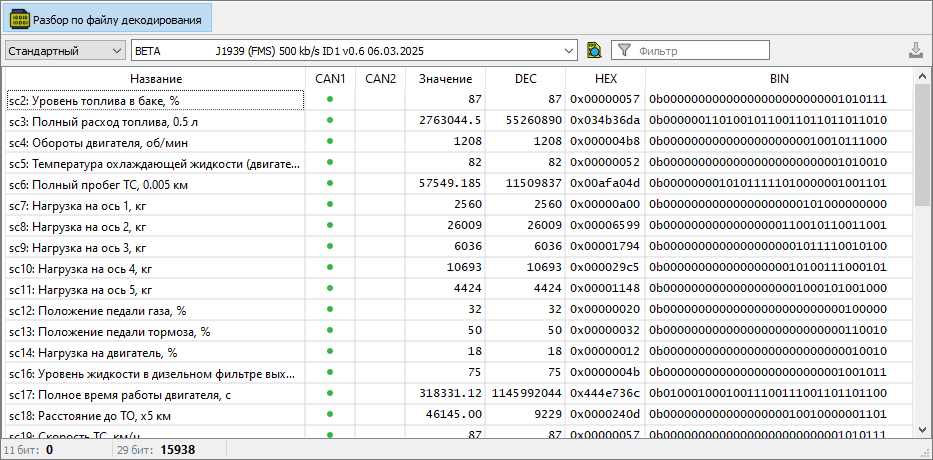
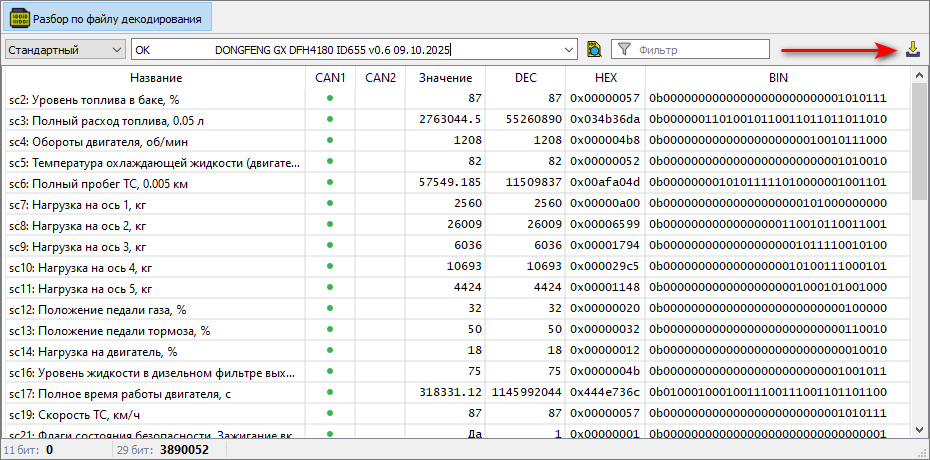
¶ 7. Decoding Using a Decoding File
The “Decoding using a decoding file” interface block is intended for searching, verifying, and uploading a suitable CAN data decoding file to the device. It allows you to select the file source, find the required file in the library using filters, review the list of parameters that the file can decode (as shown in the table below), and load it for operation.
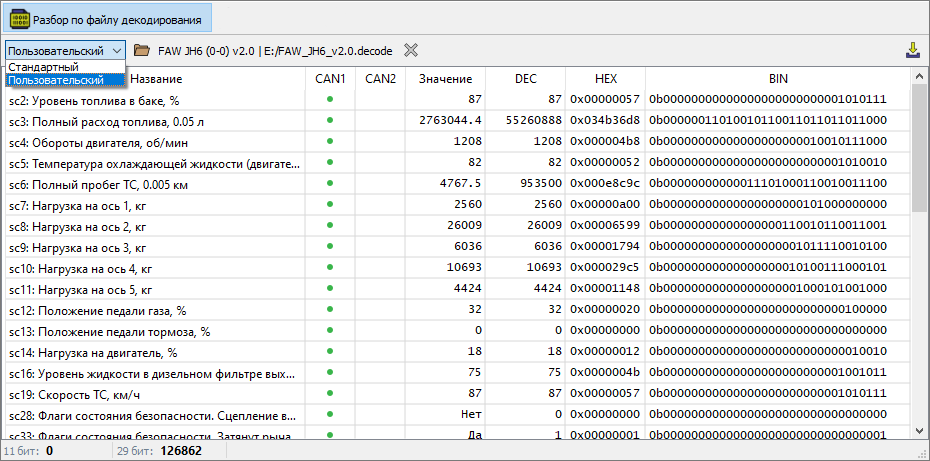
¶ 7.1 Selecting File Location
First, choose where to get the decoding file from:
- Standard - use the built-in library of ready-made program files.
- Custom - upload your own
.decodefile from your computer.
The selected mode changes the available settings.
¶ 7.2 Searching in the Library
These settings are visible only in “Standard” mode.
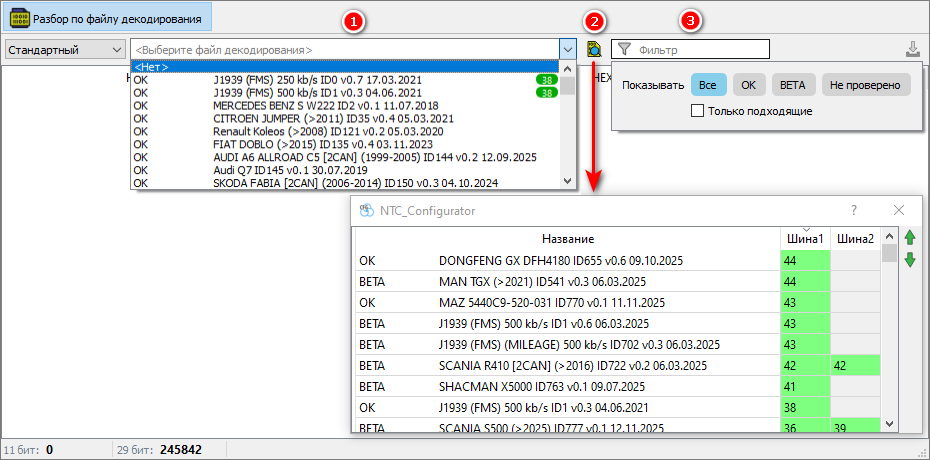
To find a suitable file in the library, you can use:
- Search field - enter the file name or its ID.
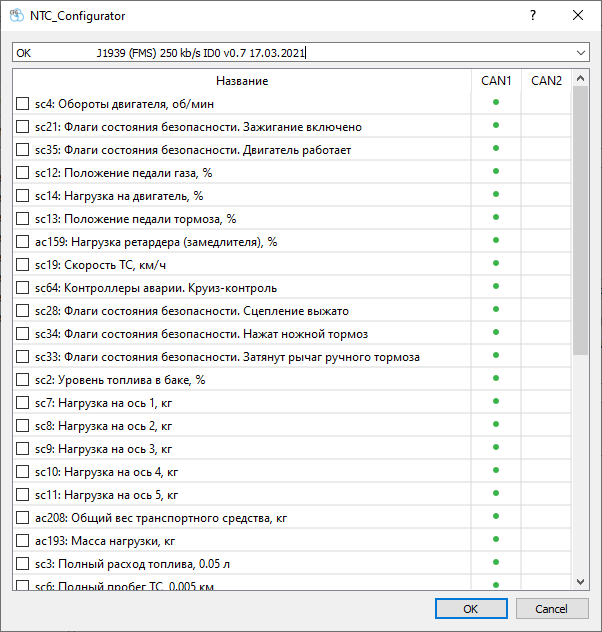
- “Show suitable decoding files” button - displays a window with a table of decoding files that can decode data from the current stream.
For each file you can see:
- Name, version, date, and status.
- Number of parameters - shows how many parameters from the current data stream this file can decode. - Filters - filter the list by file status (All, OK, BETA, Not verified) and by the “Only suitable” flag.
¶ 7.3 Uploading the File to the Device
Once a file is selected (from the library or from your computer), click the “Upload file” button to send it to the device.
Important: The “Upload file” button will be inactive (disabled) if CAN bus scanning is running. To upload a file, stop the scanning first.
¶ 8. Log Recording
The Record log tab allows saving CAN messages exactly as they were transmitted on the bus at the time of recording. This is especially useful when access to the vehicle is limited.
Log files should also be provided to Navtelecom technical support in the following cases:
- if CAN decoding for a specific vehicle has not yet been implemented;
- if data is decoded incorrectly using an existing decoding file.

¶ 8.1. Creating a Vehicle
¶ Adding a Vehicle
Before starting the recording, you must create a Vehicle object using the Add new vehicle button.
In the window that opens, specify:
- Make and Vehicle Model (required fields),
- Production years and VIN (if available).

After clicking Add, the vehicle will appear in the drop-down list.

The following buttons will also become available:
 |
Edit selected vehicle |
 |
Delete selected vehicle |
¶ Adding a CAN Bus
Click Add CAN bus to specify the connection to a particular CAN bus.
- Name - description of the connection point (for example, control unit, connector, wire colors, CAN_H and CAN_L pin numbers).
- Speed is determined automatically if message reception is active in CAN Spy.

The added bus appears in the drop-down list. The following buttons will also become available:
|
Edit selected CAN bus |
|
Delete selected CAN bus |
If logs need to be recorded from multiple buses of the same vehicle, each one should be added with the corresponding connection point description.
After selecting the CAN bus to which the device is connected, you can proceed to log recording.
When you click Record new log, the recording window opens, displaying vehicle data and the connection point. In the drop-down list, select the log type that needs to be recorded.
¶ 8.2. “Background” Log Template
In most cases, it is sufficient to record two background logs:
- Background log (ignition ON) - with the ignition turned on,
- Background log (engine running) - with the engine running.

¶ Start Recording
After selecting the appropriate template, click Start recording and follow the instructions displayed in the log recording wizard window.
Additionally, you can:
- change the recording duration,
- add a note to the recorded log.
¶ CAN Data Reception Status
At the top of the wizard window, the CAN bus data reception status is displayed. The following notifications are possible:
- CAN data reception disabled - log recording is not performed.
- No CAN data - no incoming data during recording.
- Receiving CAN data - data is being received and recording is in progress.
¶ Finish Recording
After the process is complete, click Finish - the log will be saved to the computer.
¶ 8.3. “Custom Discrete Sensor” Template
To capture changes that occur when a discrete sensor is triggered, use the “Custom discrete sensor” template.
During recording, you must:
- follow the instructions displayed in the log recording wizard;
- manually change the sensor status in the wizard interface (ON / OFF) at the moment it is triggered.

This allows capturing the corresponding changes in CAN messages related to the operation of the discrete signal.
¶ 8.4. “Custom Analog Sensor” Template
The “Custom analog sensor” template is used to search for analog sensor values in CAN bus data.
During recording, follow the instructions in the wizard and step by step specify one of the following states in the Value type field:
- Current value - if the absolute sensor value at that moment is known;
- Added - if a change relative to the previous value has been recorded.

This method allows correlating changes in CAN messages with known analog signal values.
¶ 8.5. “Custom Log with Recording Time Limit” Template
This template is recommended for recording logs where parameter changes are observed over an extended period of time.
By default, the recording duration is 5 minutes. If necessary, the Log recording duration parameter can be changed by the user.
Additional information about external conditions or specific details of the recording process can be entered in the Note field.

¶ 8.6. Saving CAN Bus Logs
To send CAN bus logs to Navtelecom technical support, you need to generate an archive containing the corresponding log files for the selected vehicle. The archive is created automatically when you click the Generate report file button.

In the window that opens, you can select the logs to be included in the archive.

By default, logs and report archives are saved on the computer in the directory:
C:\Users\Public\NAVTELECOM\NTC Configurator v3\Data\can-logger
The completed archive should be sent to: support@navtelecom.ru
Recommended email subject: CAN logs. [Make] [Model] [Year]
For example: CAN logs. Lada Granta 2022
In the email body, specify the reason for sending the logs. Possible reasons:
- Parameter decoding error (specify which ones)
- Missing required parameters in the current decoding file (list the required parameters)
- No decoding file available for the specific vehicle
The more detailed the description, the easier it will be to perform a repeated log analysis later.
¶ 9. Scripts
The Scripts tab provides tools for creating, editing, and executing visual block-based scripts designed for interaction with the CAN bus.
Scripts can receive and transmit CAN messages, use conditions, delays, repeat loops, and finish with a defined result. They are used for debugging, diagnostics, and automation of CAN equipment interaction.
¶ 9.1. Panel Functional Buttons
 |
Add script – create a new script |
The drop-down menu contains the Import file button, which allows opening previously created scripts.

To restrict access to script content, passwords can be set. A password-protected script can be uploaded to the device, downloaded from the device, executed by command, or called via a function in Complex Events.
 |
Add a protection password for selected scripts |
 |
Change password for selected scripts |
 |
Remove protection password for selected scripts |
For remote script execution via command or a function call in Complex Events, the script must be uploaded to the device memory.
 |
Upload to device – opens the script upload management window |
In the window that opens, two lists are displayed:
- Local scripts – list of scripts opened in the current CAN Spy session.
- Device scripts – list of scripts prepared for upload to the internal memory of the connected device.

Between these fields, there are arrow buttons that allow copying selected items from one list to the other.
To the right of the Device scripts list, there are buttons for managing the order of elements (move up/down) and for deleting selected items from the list.
After forming the final list in the Device scripts field, click Update script list on device. This action writes the scripts to the device memory and replaces the previously saved list.
 |
Save selected scripts |
The drop-down menu contains the following buttons:
- Save all unsaved scripts – saves changes in all scripts opened in the current session.
- Save selected script to file – saves the highlighted script to a user-specified file.

Script-related actions are also available via the context menu. To open it, right-click on a selected script in the list.

A script can be tested immediately in CAN Spy.
 |
Run selected script |
 |
Stop running script |
¶ 9.2. Script Blocks
Below are the main blocks available in the visual script editor. Each block represents a logical element of the scenario that performs one or more actions. Blocks are connected sequentially or through conditions.
¶ Send Message

Allows sending a CAN message with a specified ID and set of bytes.
Block parameters:
-
Identifier type – select one of three formats:
- standard (11 bit),
- extended (29 bit),
- PGN (J1939).
-
Message ID (HEX) – identifier used for transmission.
To the right of the ID field there is an Update ID button that automatically inserts the identifier and type from the selected message in the Messages table. -
Data (D0–D7) – input fields for each message byte. Entered manually in hexadecimal format.
¶ Pause

Adds a delay for the specified number of milliseconds. Useful for creating pauses between actions or testing device response to timing intervals.
¶ Repeat

Starts a loop with a specified number of repetitions of the nested blocks.
¶ If Received

This block defines a condition for receiving a CAN message with a specific identifier and data values. If the condition is met, the nested algorithm inside the block is executed. If the message does not match the specified parameters, execution continues along the main script flow.
Block parameters:
- Identifier type – choose between 11-bit, 29-bit ID, or PGN.
- Message ID – identifier expected from the CAN bus.
- Data – byte values used for comparison.
- Mask – bitwise mask defining which bytes participate in the comparison (
ff– byte fully considered,00– ignored).
After the condition is met (message received and matches data and mask), the script executes the blocks nested inside this condition. If the condition is not met, execution continues with the next block at the main level.
¶ Reception Condition

The Reception condition block waits for one of the nested If received conditions to be fulfilled within the specified time interval. If at least one condition is met, the corresponding nested algorithm is executed. Otherwise, the alternative code from the else section is executed.
Block parameters:
- Timeout – waiting time in milliseconds (field on the right in the block header). After this time expires, the condition is considered not met.
- Inside the block, one or more If received blocks can be placed, each checking for a specific message by ID and data with mask.
- If the condition is not met within the timeout, the else section is activated.
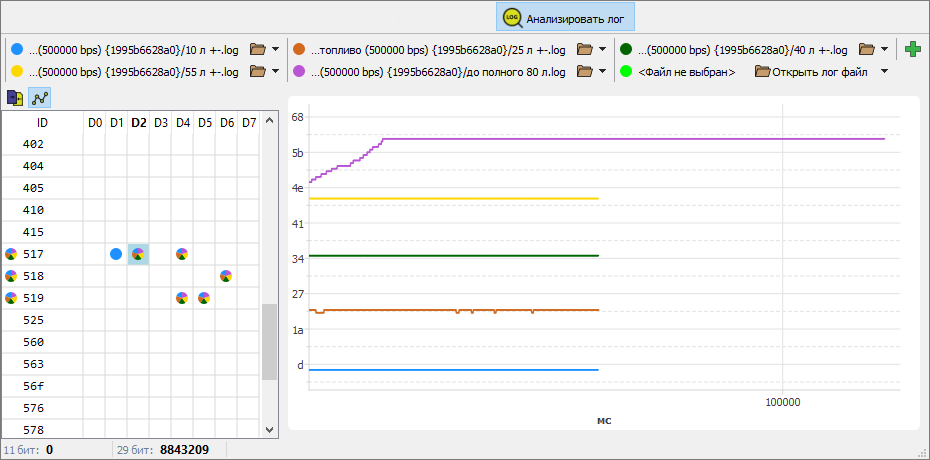
¶ 10. Analyze Log
This block is intended for in-depth analysis and comparison of recorded logs. While a standard log view shows a stream of messages over time, this tool allows you to:
- Compare the contents of two or more logs.
- Quickly find differences in data sets between logs.
- See how the value of each byte in a message changed throughout the entire file.
The tool switches between two display modes: Graphs and Value Table. Supported file formats: proprietary binary .log, as well as .csv and .trc.
¶ 10.1. Interface Structure
The interface is divided into four main areas:
-
Log Addition Panel (top)
- Used to select log files for analysis. Each added log is assigned its own color marker.
-
View Mode Panel (left above the table)
- Graphs – the right area displays graphs of byte value changes over time.
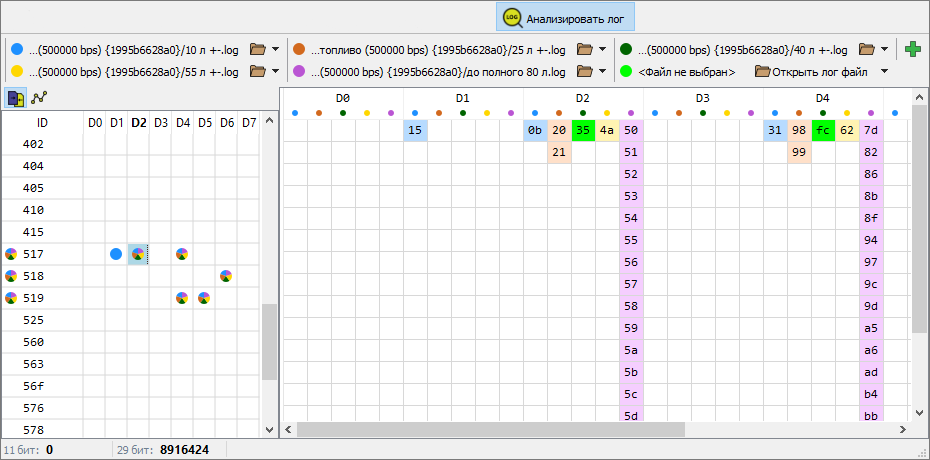
- Value Table – the right area displays a table with unique values.
-
Summary Table (left)
- The main table, where rows correspond to CAN message identifiers (ID) found in the logs.
- Each ID has 8 cells (one for each data byte in the message).
- Colored markers in cells – a key element. They show whether there are differences in the set of values for a specific byte of that ID between the loaded logs.
- If there is no marker – this byte has the same set of values in all logs.
- Single marker – this byte has unique values only in the log of that color.
- Composite marker (multiple colors) – differences for this byte exist in several logs, indicated by their colors.
-
Graph/Table Area (right)
- A dynamic area. What is displayed depends on the selected mode and what was clicked in the summary table on the left.
¶ 10.2. Scenario: Analyzing a Single Log
When only one log is loaded, it is treated as the reference, so all cells in the summary table will be marked with its color.
-
If you click on a row with a message ID:
- In the right area (“Graphs” mode), 8 graphs will be displayed — one for each byte (0–7) of the message. The horizontal axis represents time (or record index), and the vertical axis represents the byte value (0–255).
- In the right area (“Value Table” mode), a table will open where rows represent all unique values encountered for each of the 8 bytes of that ID in the log, sorted in ascending order.
-
If you click on a specific marked cell (for example, byte 3):
- In the right area (“Graphs” mode), only one graph for the selected byte will be displayed.
- In the right area (“Value Table” mode), the table will show only the unique values for that specific byte.
¶ 10.3. Scenario: Comparing Two or More Logs
The main power of the tool appears when multiple logs are loaded for comparison.
-
In the summary table, markers appear only in those cells (ID + byte) where the sets of values for that byte differ between logs.
- The marker will be composite: it contains only the colors of the logs that have unique (different from others) values for that byte.
-
If you click on a row with a message ID:
- In the right area (“Graphs” mode), 8 sets of graphs will be displayed. In each set (for byte 0, 1, ... 7), graphs from all loaded logs will be overlaid. This allows visual comparison of byte value dynamics across different logs.
- In the right area (“Value Table” mode), a table will open showing only the byte values that differ between logs. If the set of values for a particular byte is identical in all logs, there will be no rows for it. Table columns represent bytes (0–7), and rows represent unique differing values.
-
If you click on a cell (even without a marker):
- The right area will display graphs or a value table only for the selected byte, but with data from all logs. This allows detailed analysis of a specific message position, even if there are no differences (in that case, graphs/values will match).
¶ 10.4. Quick Reference
| Action | Result |
|---|---|
| Add log | IDs appear in the summary table, cells are marked with the log color. |
| Click on ID row | The right area displays data for all 8 bytes of the message. |
| Click on byte cell | The right area displays data only for the selected byte. |
| Switch to “Graphs” | The right area shows a visual timeline of value changes. |
| Switch to “Value Table” | The right area shows a text list of unique or differing values. |
| More than one log loaded | Markers show only bytes with differences. Marker color = log with difference. |
This tool is indispensable for identifying anomalies, comparing a reference log with a problematic one, and for deep analysis of CAN message structure.