¶ General Information
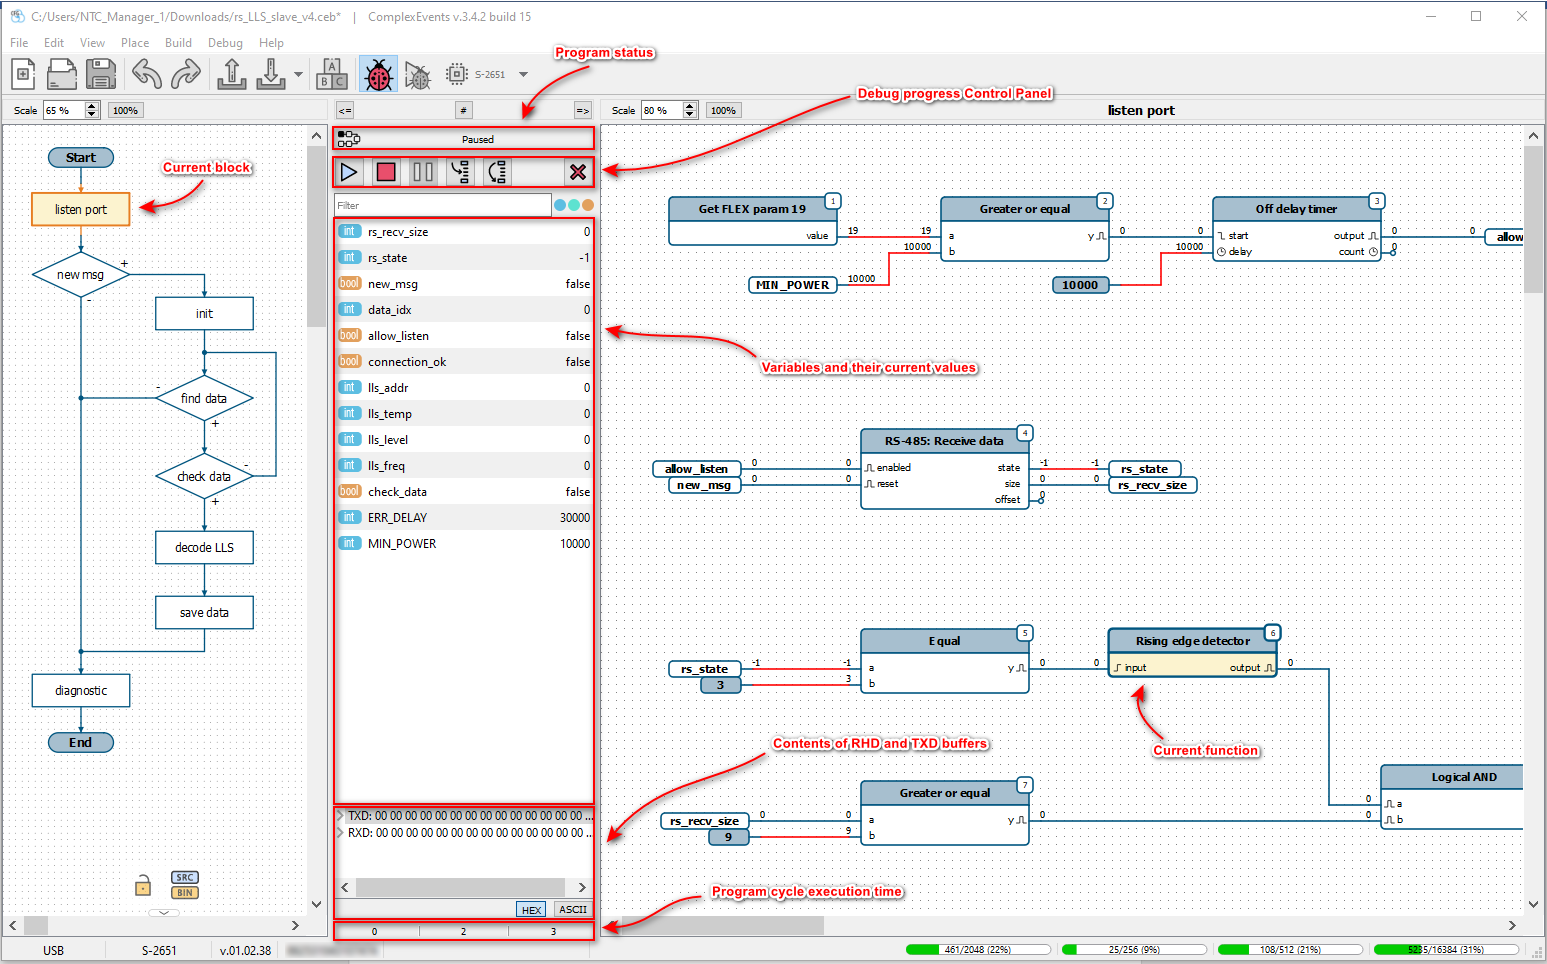
In debug mode, application prevents changes to the current diagram. Middle panel with elements of the diagram is replaced by a debug panel.
Debug panel displays:
- program status bar
- buttons to сontrol program execution
- list of variables
- content of input and output buffers
- information about execution time of the program cycle
¶ Program Status Bar
Program can be in the following states:
- No program – no program has been uploaded into the device or it has been uploaded with error.
- Error – error occurred during execution of the program.
- Stopped – program execution is stopped. At the next start of the program, variables are initialized and program starts from the first function.
- Upload – recording program to the device.
- Paused – program execution is paused. When program is resumed, it will continue execution from the current function. In this mode, current function and its block are highlighted in the editor windows.
- Execution – device is executing the program.
After exiting the debug mode, device will start or continue the program (depending on the current state), but only if the program was not in the modes No program or Error.
¶ Program Execution Control
To control program execution, special buttons are provided under the program status bar (these buttons are duplicated in the Debug menu):
-
Continue – if program is in the Stopped state, this button launches the program for execution; if the program is in the Paused state, this button continues program execution from the current function.

Continue button -
Stop – stops program execution (transfers to the Stopped state).

Stop button -
Pause – pauses program execution (transfers to the Paused state).

Pause button -
Step – executes one function and pauses at the next.

Step button -
Cycle – executes all functions until it goes to the beginning of the program; stops at the first function.

Cycle button -
Send user command – opens a dialog box for sending data to user command. This button is displayed in the middle panel only if the program uses CMD function.

Send user command button -
End debug – ends debugging the program, exits the device from debug mode and switches the editor to normal mode.

End debug button
¶ Breakpoints
To stop the program before executing a particular function, application has breakpoints.
To set and remove a breakpoint, you need to right-click on the required function and select Toggle Breakpoint menu item (duplicated in the Debug menu).
Toggle Breakpoints function is available not only in the debug mode, but also in the project diagram editing mode.
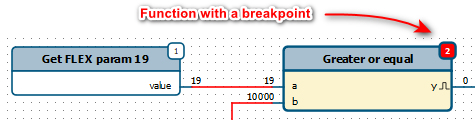 |
| Function with breakpoint |
Device physically supports up to 8 breakpoints.
List of the current breakpoints can be viewed in the Breakpoints area (opened via View - Breakpoints menu item).
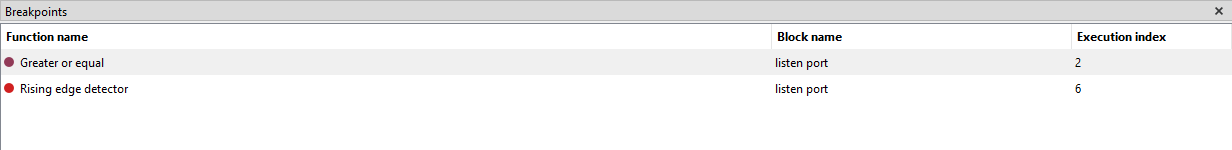 |
| Breakpoints area |
Through this area you can:
- delete breakpoints by selecting the ones you need and clicking Del key
- when you double click on breakpoint in the list, editor will show the function on which it is set
¶ Current Values
In debug mode, application on the diagram displays current values at the inputs and outputs of functions (directly above each data output).
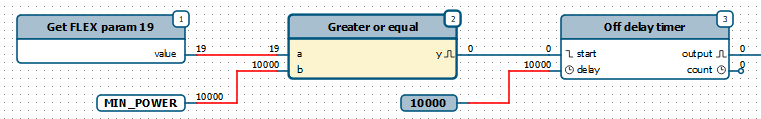 |
| Current values at inputs and outputs |
Values are read from the device with the period specified in settings of the application.
Under the buttons in the middle part of the program there is a list of used variables with current values.
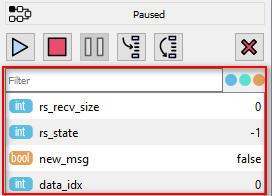 |
| List of variables and their current values |
This list can be filtered by variable name or by data type.
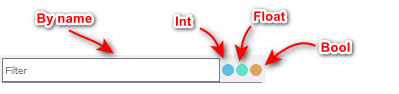 |
| Options for filtering the list of variables |
If in the variable properties Write access option is set, then value of the variable can be changed during debugging. To do this, double-click on the required variable in the list.
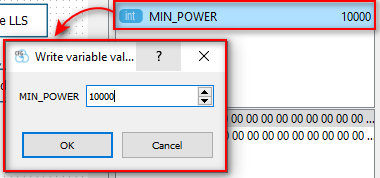 |
| Writing variable value during debugging |
¶ Cycle Execution Time
Program is executed cyclically. Time of one cycle may vary depending on the state of the program data or the load on the device. To estimate the program execution time, device measures the cycle period.
On the panel in the middle part of the program, below the list of variables, minimum, maximum and average cycle time in milliseconds are displayed.
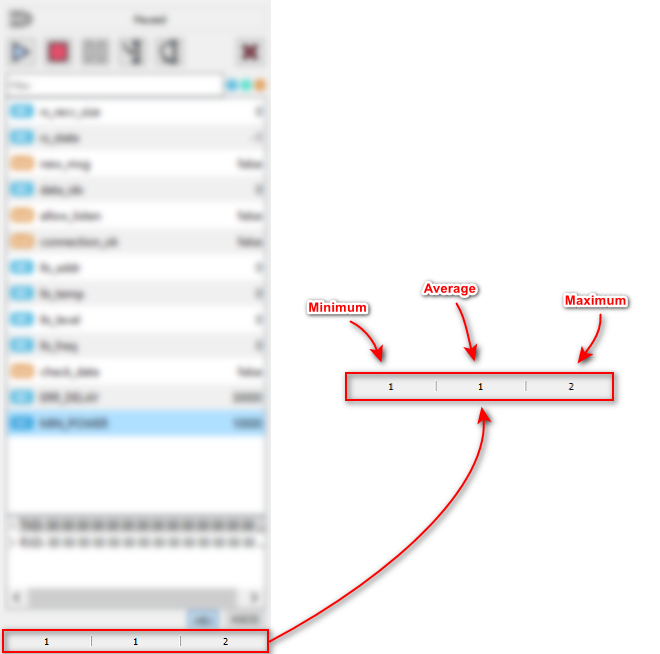 |
| Cycle time counters |
 Previous Guide
 Next Guide